The MainBrainer Dashboard is the default screen displayed when you log in to your account. The Dashboard gives a bird’s eye view of the KPIs you wish to monitor and the performance statistics of your latest campaign sendings.
While navigating the platform, if you wish to return to this default screen, click the MainBrainer logo in the top-left corner, and you’ll be redirected here.
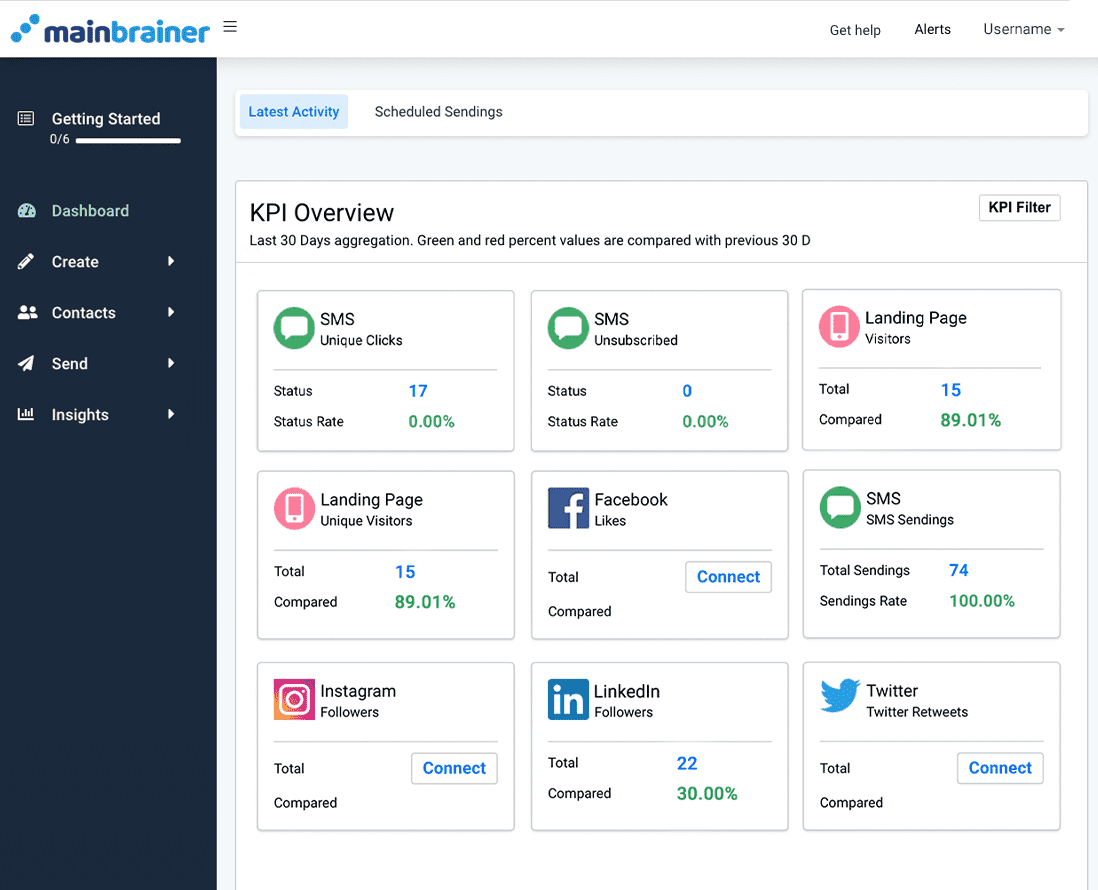
In the dashboard, you can toggle between the two tabs – Latest Activity, and Scheduled Sendings (as highlighted in the screenshot below).
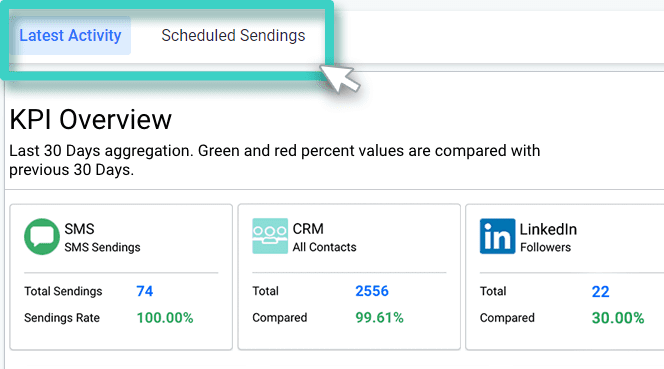
The tab Scheduled Sendings displays all the campaigns scheduled for sending.
The tab Latest Activity gives an overview of the KPIs you wish to monitor. It has the following distinct sections:
1. KPI Overview
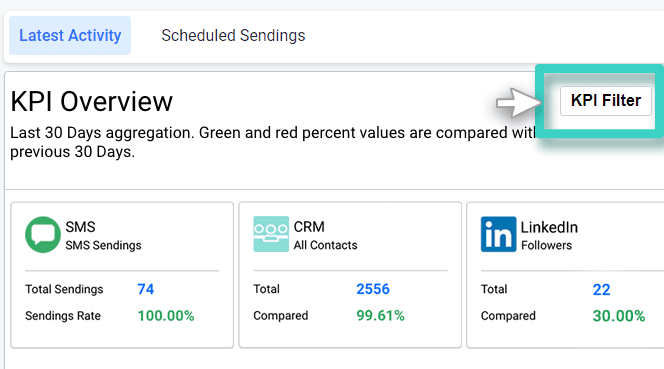
Use the KPI Filter button (as highlighted in the screenshot below) to select the KPIs that you wish to monitor. The selected KPIs will be displayed in this section with two types of data:
- aggregate data for the last 30 days
- percentage change of the aggregate data with respect to the data over the previous 30 days interval.
2. Last Sent
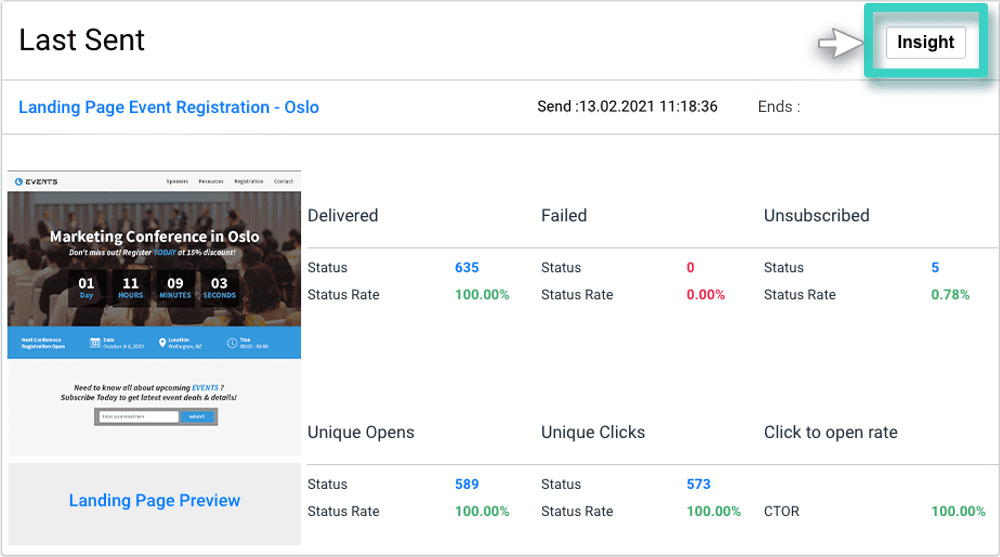
This section displays an overview of the key performance metrics of the last sent campaign. For detailed performance insights of the sending, click the Insight button (as highlighted in the screenshot below).
3. CRM Lists
This section displays all the contact lists created in your MainBrainer account so far.
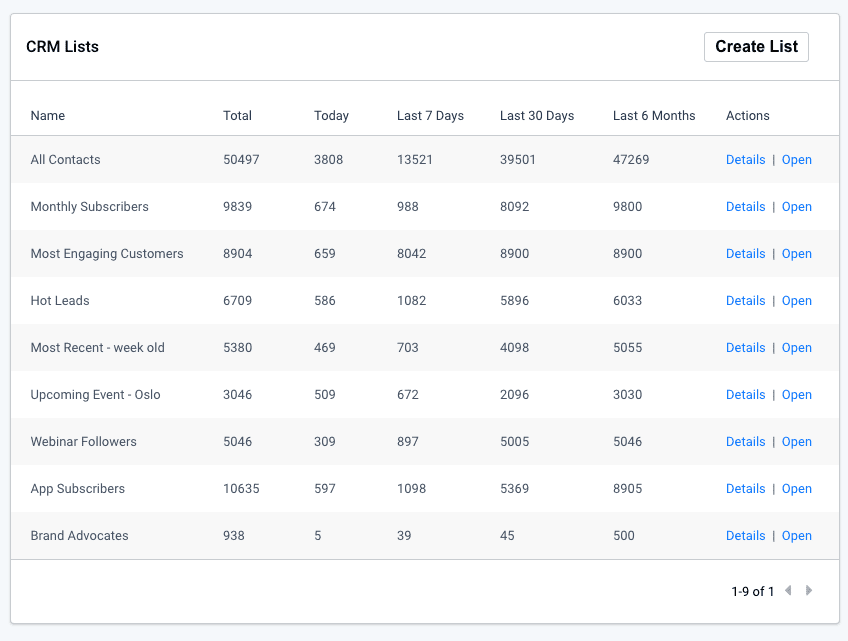
It also displays the number of contacts in each list along with the contact addition trends. For a graphical analysis of the list growth, click the Details button for that list.
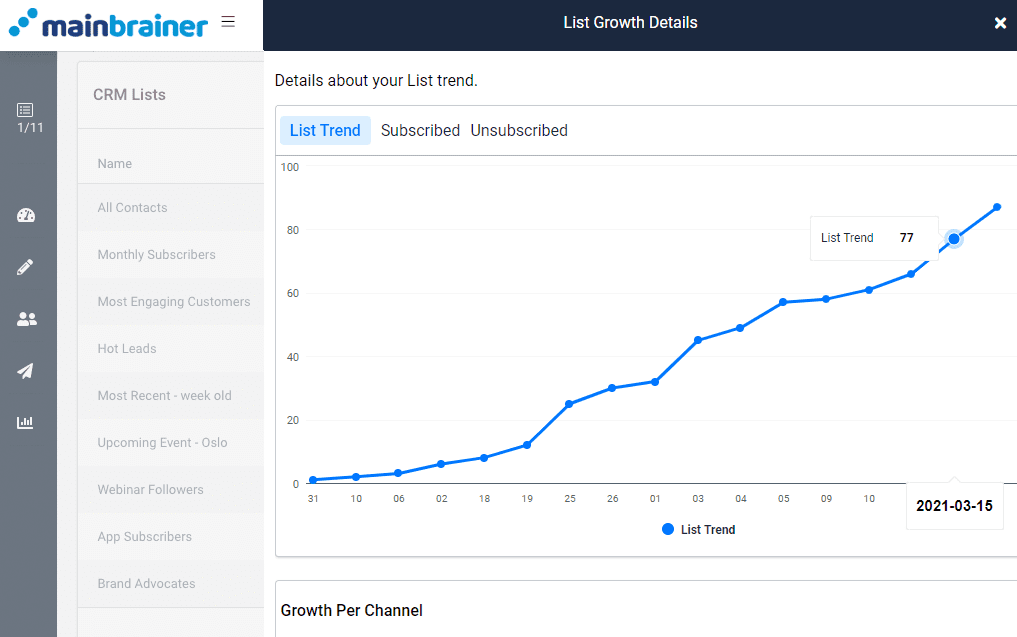
A graphical display of the list-growth trends will be displayed in a sidebar along with the subscribe and unsubscribe trends. A channel-wise breakup will also be displayed listing the channel-specific contribution to the contact list growth.
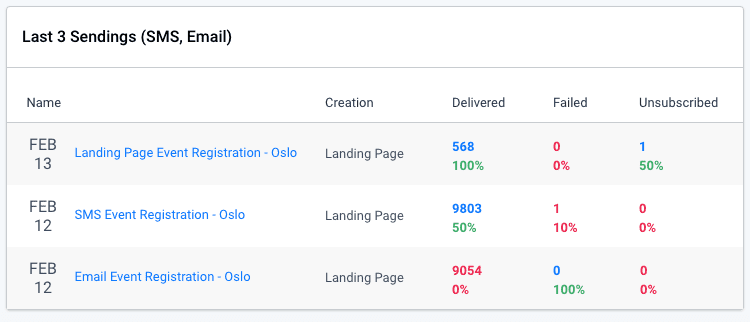
4. Last 3 Sendings
This section gives an overview of the last three campaigns sent from your MainBrainer account.
5. Website, Ads, Social, and QR Code
For the landing pages shared via QR codes or directly shared via social media or your website, this section displays the two landing pages that had the most recent activity (clicks, form submission, etc.).

