Step 1
Navigate to Landing Page Insights.
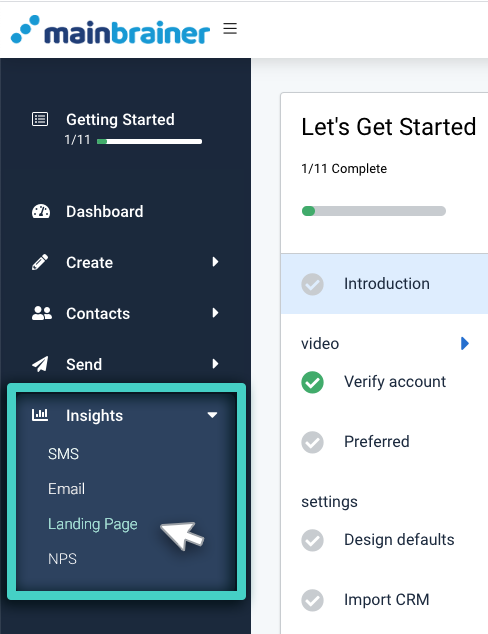
Use the Main Menu on the left to expand the Insights menu, and click Landing Page.

Step 2
Select the Relevant Landing Page
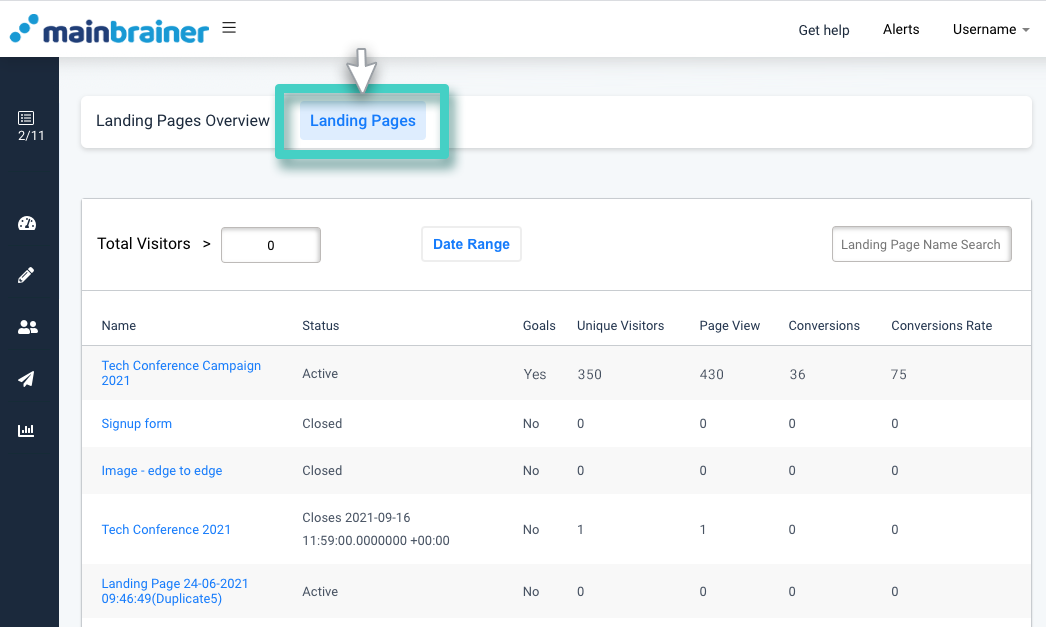
On the subsequent screen, open the tab Landing Pages (as highlighted in the screenshot below). As you do, a list of all active landing pages will be displayed. From this list, click the landing page for which you wish to view the performance analytics.

Step 3
Monitor the Landing Page Performance!
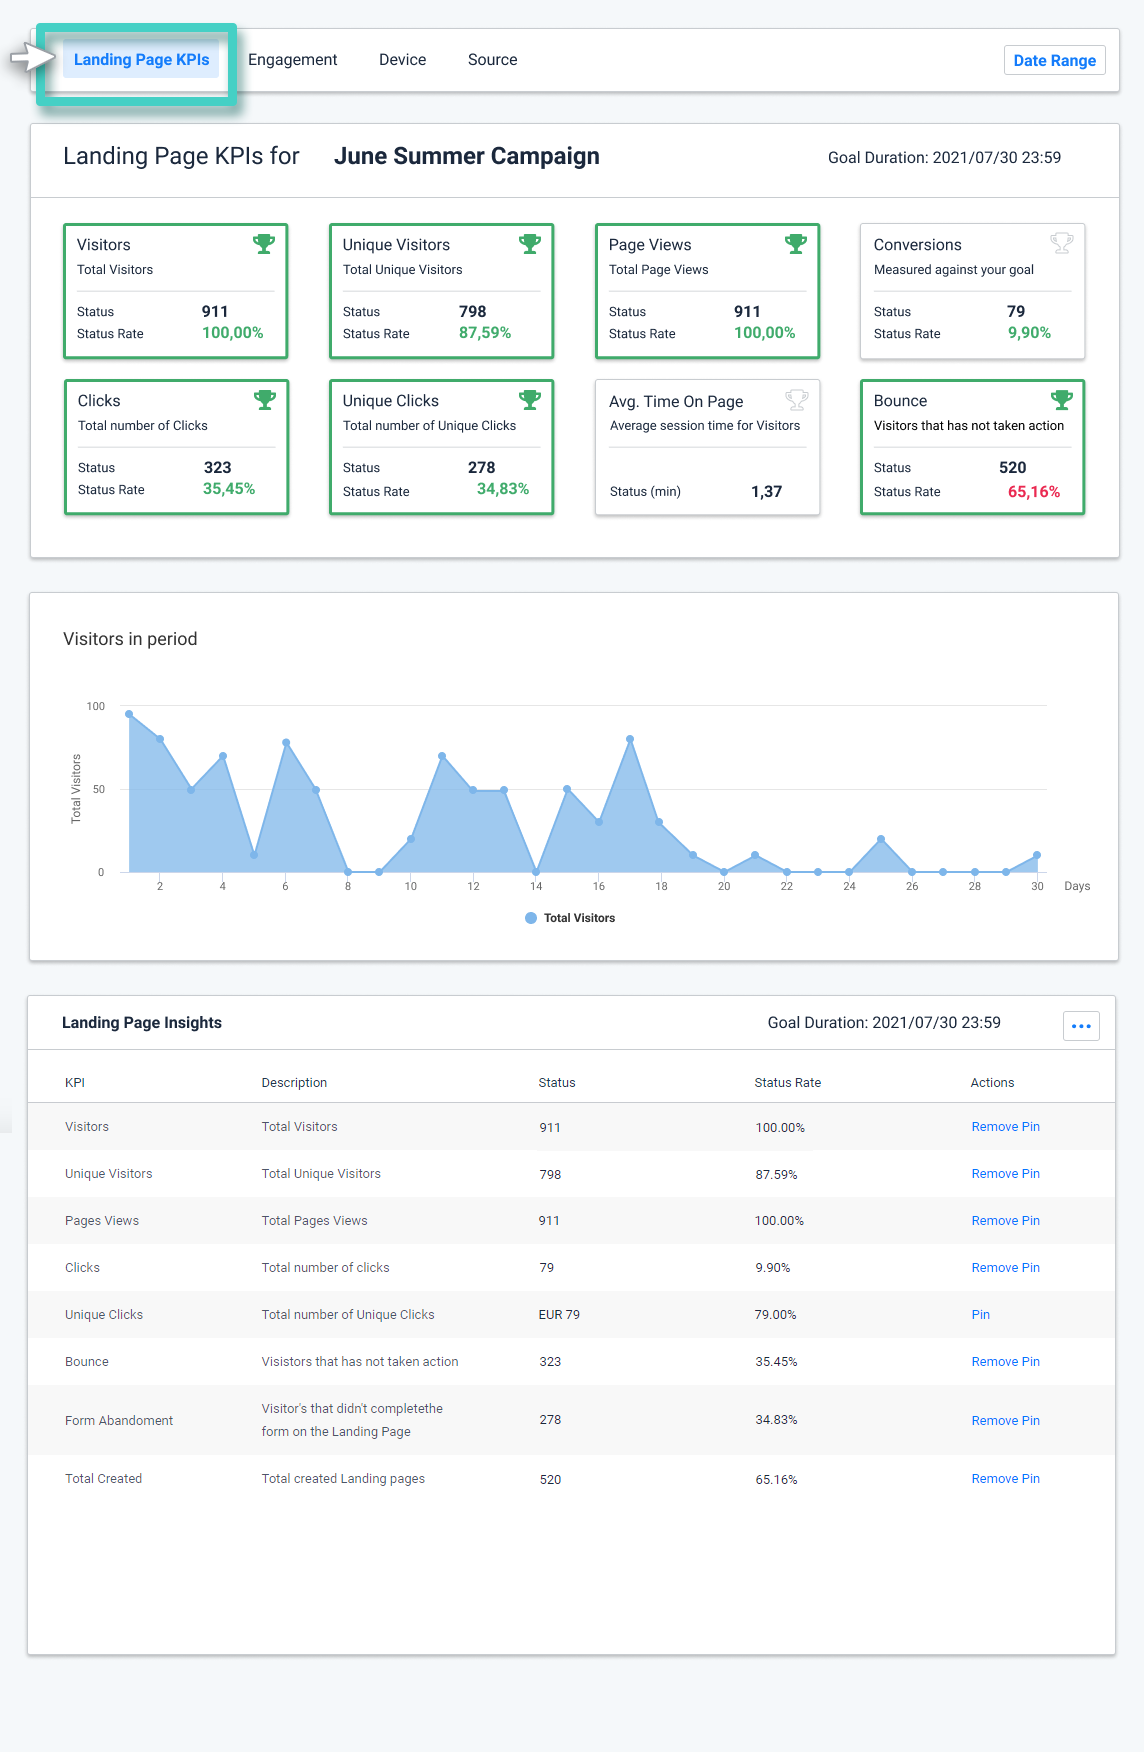
The real-time performance of the landing pages can be viewed under the Landing Page KPIs tab (as highlighted in the screenshot below).

As you’ll notice in the above screenshot, next to the KPIs, the columns – Goal, and Goal% display the goals set for the landing page.
Next is the column – Actions, where color-coded icons show whether the campaign achieved its goals or not.
Here, the different colored icons represent different performance statuses:
![]()
- The green icon represents that the goal has been achieved within the specified time duration.
- The yellow icon represents that the goal has been achieved, albeit after the expiry of the specified time duration.
- The light-grey icon represents an ongoing goal that hasn’t yet been achieved yet, i.e., there is still time left before the time duration specified for goal measurement ends.
- The red icon represents that the goal has not been achieved.
