Email – Aggregate Analytics
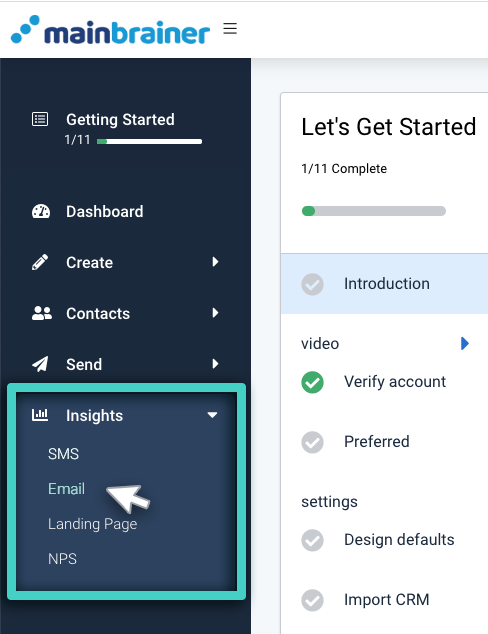
Using the Main Menu on the left, expand the Insights menu and click Email.
The subsequent screen, by default, displays an overview of the different Email KPIs and their values:
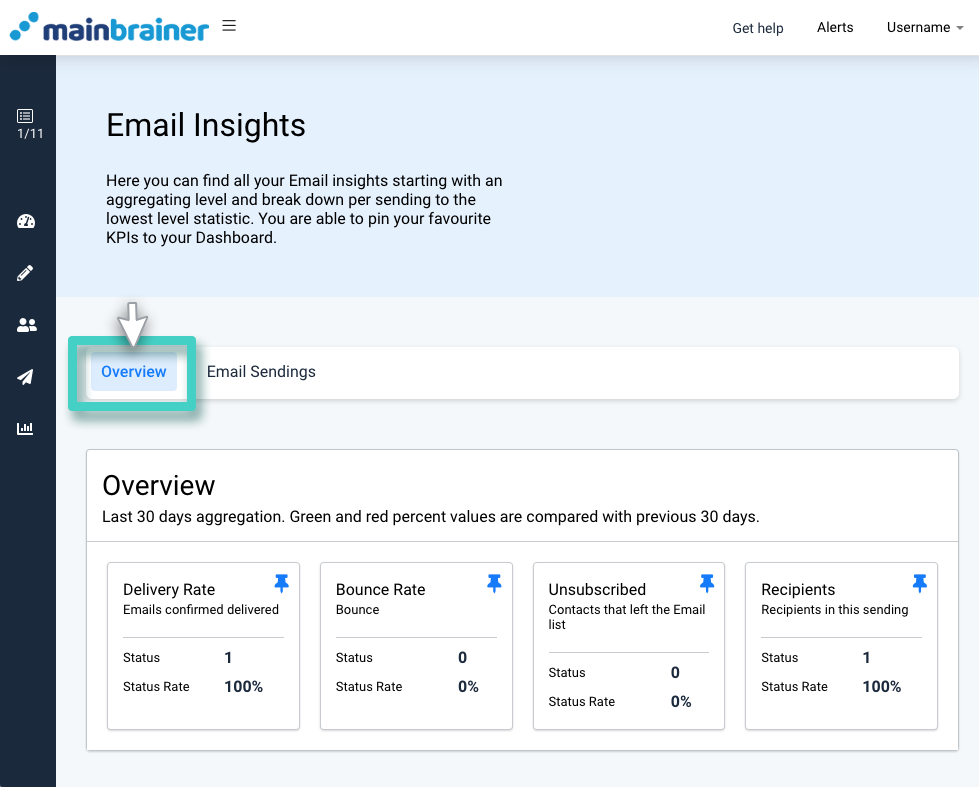
As you scroll down this page, you’ll notice the following three sections:
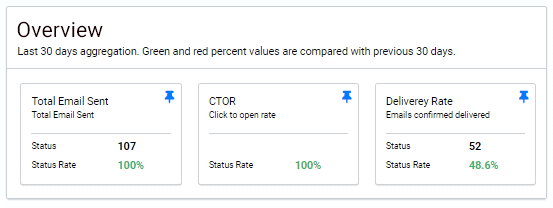
- The Overview section displays the pinned KPIs with their values for your easy reference.
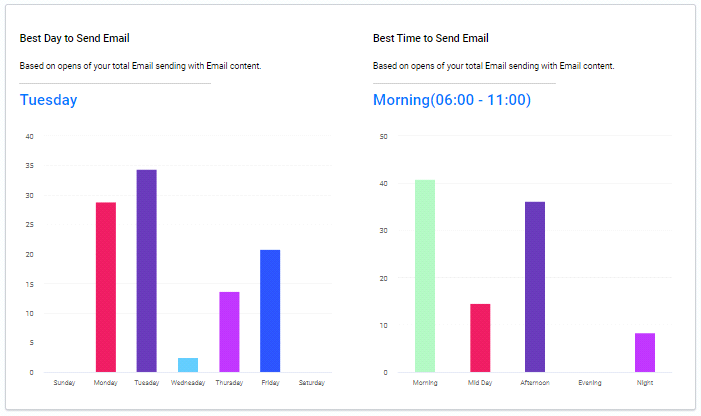
- The Best Day to Send Email, and the Best Time to Send Email sections graphically display the best day and time to send an Email based on the past open rates of your total Email Sendings.
- The Aggregated Email Insights Last 30 Days section lists the KPIs and their values for your Emails.
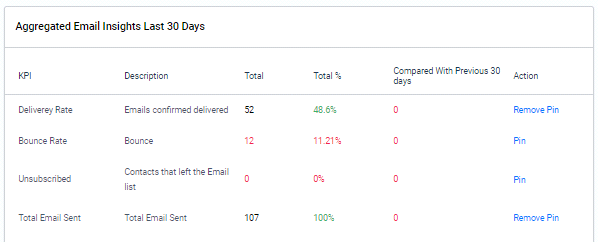
Corresponding to each KPI, the absolute values are displayed under the column Total, and percentage values are displayed under the column Total %.
For easier identification of the metric ranges, we follow the following color-coding to highlight the different range values of the Status rates:
- Status rates < 20% are displayed in a red-colored font.
- 20% < Status rates < 40% are displayed in a yellow-colored font.
- Status rates > 40% are displayed in a green-colored font.
Email – Specific Analytics
If you wish to view the analytics for a specific Email, click on the Email Sendings tab, and navigate to the desired Email Sending.
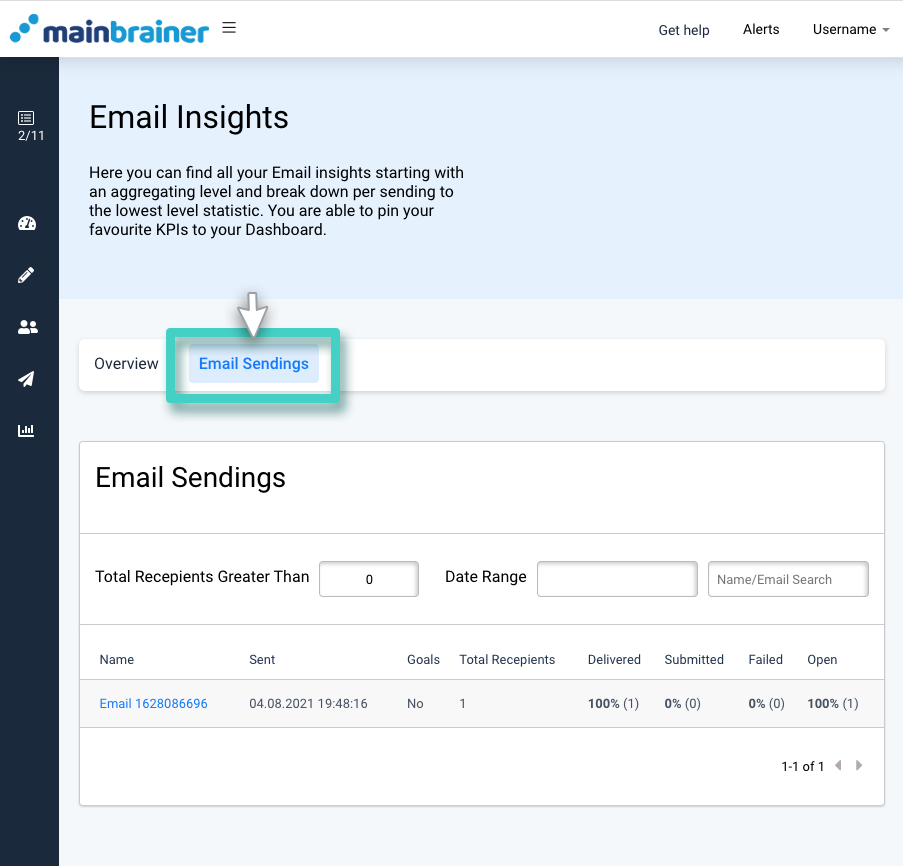
The subsequent page displays all the KPIs and their real-time values for the selected Email under four different tabs:

- Email KPIs – The data under this tab highlights the specified Email’s performance statistics in the last month.
- Recipients – The data under this tab analyses the recipient details for the selected Sending, such as the demographic makeup of the recipients, the percentage of unsubscribes, etc.
- Distribution – The data under this tab graphically displays the distribution statistics for the selected Sending, such as the number and percentages of Emails delivered, soft bounces, and hard bounces.
- Engagement – The data under this tab highlights the performance statistics of the widgets used in the specified Email.
- Device – The data under this tab compares the performance statistics of the Email across different devices.
